
Exploring Lens: A Powerful Kubernetes Monitoring Tool
Efficiently managing Kubernetes clusters is essential for ensuring the stability and performance of cloud-native applications. Lens is an open-source integrated development environment (IDE) designed for managing Kubernetes clusters. It allows users to connect to multiple clusters from a single interface, making it easier to monitor resources, deploy applications, and troubleshoot issues. Available on Mac, Windows, and Linux, Lens provides a graphical interface that abstracts the complexity of using command-line tools like kubectl, enabling both beginners and experienced users to manage their Kubernetes environments effectively.
In this blog, we’ll explore Lens, its key features, and how it enhances your Kubernetes experience.
Key Features of Lens
- Cluster Management
Lens simplifies adding and managing multiple Kubernetes clusters. It provides a centralized view of all connected clusters, making it easy to switch between them as needed
- Real-Time Monitoring
With built-in monitoring capabilities, Lens offers real-time insights into resource utilization metrics for nodes and pods. You can track CPU and memory usage effortlessly, helping you detect and resolve performance bottlenecks quickly
- Accessing Logs
Lens provides a unified interface to retrieve logs from all your applications. This feature is invaluable for debugging, allowing you to filter logs and pinpoint issues efficiently
- Workload Management
The Workloads tab in Lens provides an overview of all active workloads, including pods, deployments, and services. It offers visual indicators and graphs to help you monitor their health and performance at a glance
- Integrated Terminal
Lens features a built-in terminal that allows you to run commands directly within your cluster without leaving the application. This makes it easy to perform quick actions like restarting pods or checking configurations
- Resource Management
With Lens, you can create, update, and delete Kubernetes resources directly from its interface. The built-in YAML editor includes syntax highlighting and validation, ensuring your configurations are accurate and error-free
- Network Visualization
Lens offers a visual representation of the relationships between services, pods, and external endpoints within your cluster. This helps you better understand traffic flow and diagnose network issues more efficiently
- Security Features
Lens supports Kubernetes Role-Based Access Control (RBAC), allowing you to grant engineers secure access to specific namespaces without exposing the entire cluster
Getting Started with Lens
- Download the Application
- Open Lens and navigate to the Catalog. Here, you can add your Kubernetes clusters by selecting them from the available options
- Once connected, use the Workloads tab to track the health and performance of your applications in real time
- Utilize Lens logging features to troubleshoot issues quickly by accessing logs directly from the workload view
Lens vs. Traditional Kubernetes Monitoring Tools
- Customization
While tools like Prometheus and Grafana offer deeper customization for dashboards and alerting, Lens can integrate with these systems for a more flexible monitoring experience.
- Real-Time Interaction
Unlike Prometheus, which focuses on storing historical metrics, Lens enables real-time cluster interaction, making immediate troubleshooting easier.
- Log Monitoring
Lens includes built-in log viewing, reducing the need to switch between multiple tools. In contrast, Prometheus and Grafana primarily focus on metrics and alerting.
Overview of Lens and Kubernetes Monitoring Components
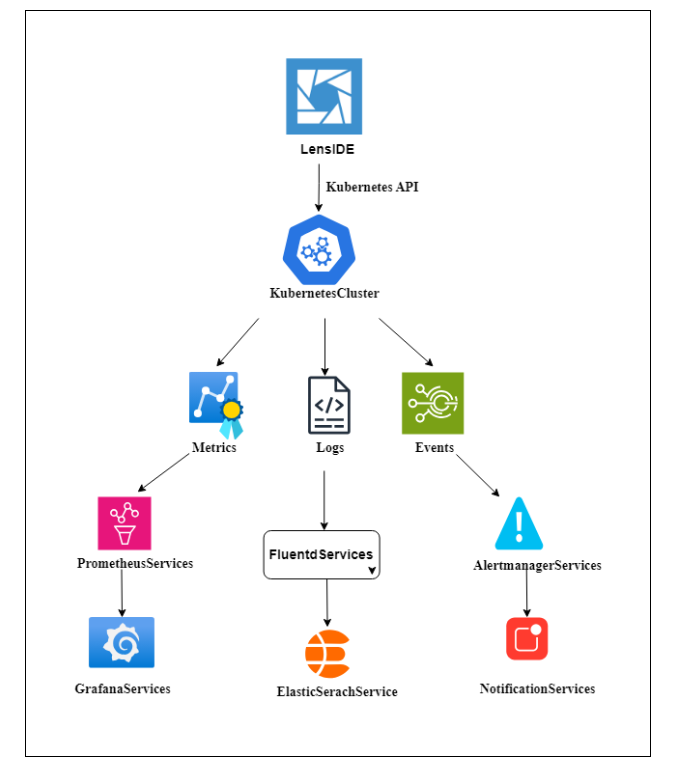
Lens IDE (User Interface): Lens is a Kubernetes IDE that provides a visual interface for monitoring and managing clusters. It collects and displays key operational data from the Kubernetes environment, including:
- Resource Utilization: CPU, Memory, Disk I/O, etc
- Cluster Health: Pod, Service, and Node status
- Log Monitoring: Logs from running containers
- Event Tracking: Real-time events from the Kubernetes API
This data is presented intuitively, making cluster management more accessible.
1. Kubernetes Cluster (Core System):
- A Kubernetes cluster consists of nodes running containerized workloads
- Lens interacts with the Kubernetes API to retrieve essential metrics, logs, and events, providing real-time visibility into cluster operations
2. Metrics Collection (Prometheus):
- Prometheus is an open-source monitoring tool that collects key performance metrics from Kubernetes clusters, containers, and applications
3. Log Aggregation (Fluentd/ElasticSearch):
- Log aggregators like Fluentd collect logs from Kubernetes workloads and store them in systems like Elasticsearch
- Lens presents these logs alongside cluster metrics, offering a unified view of system health and simplifying troubleshooting
4. Events Monitoring (Kubernetes Events/Alertmanager):
- Kubernetes generates critical events (e.g., pod restarts, resource limits exceeded)
- Lens displays these events in real-time and integrates with Alertmanager to trigger alerts for critical issues, like resource depletion or failed deployments
5. Visualization and Dashboards (Grafana):
- Lens integrates with Grafana for advanced data visualization
- Allowing users to access customizable dashboards that provide insights into cluster performance
6. Alerting and Notification Systems:
- Lens monitors alerts triggered by systems like Alertmanager when thresholds are exceeded
- It supports notifications via email, Slack, or other messaging platforms, ensuring teams can respond to issues quickly
Flow of Data in Kubernetes Monitoring
- Metrics: Prometheus collects Kubernetes metrics such as resource usage and pod performance, then displays them in Lens for real-time monitoring.
- Logs: Fluentd aggregates logs from pods, stores them in Elasticsearch, and Lens presents them on the monitoring dashboard for easy access.
- Events: Kubernetes events (e.g., pod failures, deployments) are captured via the Kubernetes API and displayed in Lens.
- Alerting: Alerts triggered by Prometheus or Kubernetes events are sent through Alertmanager, notifying operators via Slack, Email, or other messaging platforms.
Key Benefits of this Architecture
- Centralized Management: Lens acts as a central hub for monitoring multiple clusters, seamlessly integrating with external monitoring and alerting tools.
- Real-Time Monitoring: By aggregating metrics, logs, and events, Lens provides a comprehensive, real-time view of your Kubernetes environment.
- Scalability: With Prometheus and Grafana, this architecture scales horizontally, supporting large, dynamic, and complex Kubernetes clusters.
- Efficient Troubleshooting: Consolidating logs, metrics, and events in one place accelerates issue identification, enhancing debugging and troubleshooting efficiency.
Conclusion
Lens is a powerful tool that simplifies Kubernetes management with an intuitive interface for monitoring, troubleshooting, and deploying applications across clusters. This tool caters to a wide range of users, from beginners to seasoned experts, by streamlining their workflows, improving productivity, and guaranteeing seamless application performance in production environments. By leveraging Lens, you can optimize your Kubernetes setups and elevate your operational efficiency significantly.