
Introduction
Forecasting demand is vital for managing inventory, reducing waste, and keeping customers satisfied. Inaccurate predictions can cause costly overstock or damaging shortages. Many businesses still rely on manual methods or spreadsheets, which often miss patterns, sudden changes, and seasonality. To solve this, I built an AI-powered forecasting application that uses time series algorithms to turn historical sales data into reliable predictions. This blog outlines the workflow, algorithms tested, technology stack, and key takeaways from this proof of concept.
The Business Challenge
Accurate demand forecasting has always been a complex task due to fluctuating market conditions, seasonal trends, and unexpected demand spikes. Many organizations rely on manual forecasting methods or basic spreadsheets, which:
- Lack of ability to capture complex patterns in historical data
- Fail to adjust to sudden changes or anomalies
- Require constant human input, increasing the risk of errors
The inability to predict demand effectively often results in overstocking, which ties up capital, or stockouts, which harm customer satisfaction and revenue.
Why I Built This Solution
The objective was to create a forecasting tool that:
- Delivers accurate, data-driven predictions
- Supports both short-term and medium-term forecasting
- Allows flexibility in choosing algorithms based on business needs
- Integrates seamlessly with existing sales workflows
This Software Product was designed to validate whether ML.NET’s time series capabilities could be applied in a real-world forecasting scenario, with the option to use different algorithms depending on data patterns.
Time Series Algorithms
To provide flexibility and accuracy, multiple forecasting algorithms were evaluated.
1. SSA (Singular Spectrum Analysis)
-
- Type: Statistical decomposition
- Data Requirement: 30–45 daily data points
- Forecast Horizon: Up to 14 days
- Best For: Short-term forecasting with limited data
- Pros: Works well for trends, small datasets, and noise reduction
- Cons: Limited seasonality handling, weak for long-term forecasts
2. Holt-Winters (Triple Exponential Smoothing)
-
- Type: Statistical
- Data Requirement: 2–3 months
- Forecast Horizon: Up to 30 days
- Best For: Data with trend and seasonality
- Pros: Handles both trend and seasonal components, easy to interpret
- Cons: Assumes repeating patterns, struggles with irregular cycles
3. ARIMA (Auto Regressive Integrated Moving Average) / SARIMA (Seasonal Auto Regressive Integrated Moving Average)
-
- Type: Statistical
- Data Requirement: Multiple seasonal cycles
- Forecast Horizon: Varies depending on dataset
- Best For: Stationary and seasonal stationary data
- Pros: Highly interpretable, effective for many datasets
- Cons: Requires tuning, less effective for complex seasonality
4. Prophet
-
- Type: Model-based decomposition
- Data Requirement: ~1 year of data
- Forecast Horizon: Flexible, based on historical coverage
- Best For: Seasonal data with irregular patterns and events
- Pros: Handles missing data, minimal tuning
- Cons: May oversimplify highly volatile data
5. ML-Based (XGBoost, LightGBM)
-
- Type: Machine Learning Regression
- Best For: Data influenced by external factors
- Pros: Handles non-linear relationships, works with additional features
- Cons: Requires feature engineering, time dependency may be lost without care
6. Deep Learning (LSTM, GRU, TCN)
-
- Type: Neural Networks
- Best For: Complex, long-term dependencies in large datasets
- Pros: Captures intricate temporal patterns
- Cons: Requires large datasets, computationally expensive, less interpretable
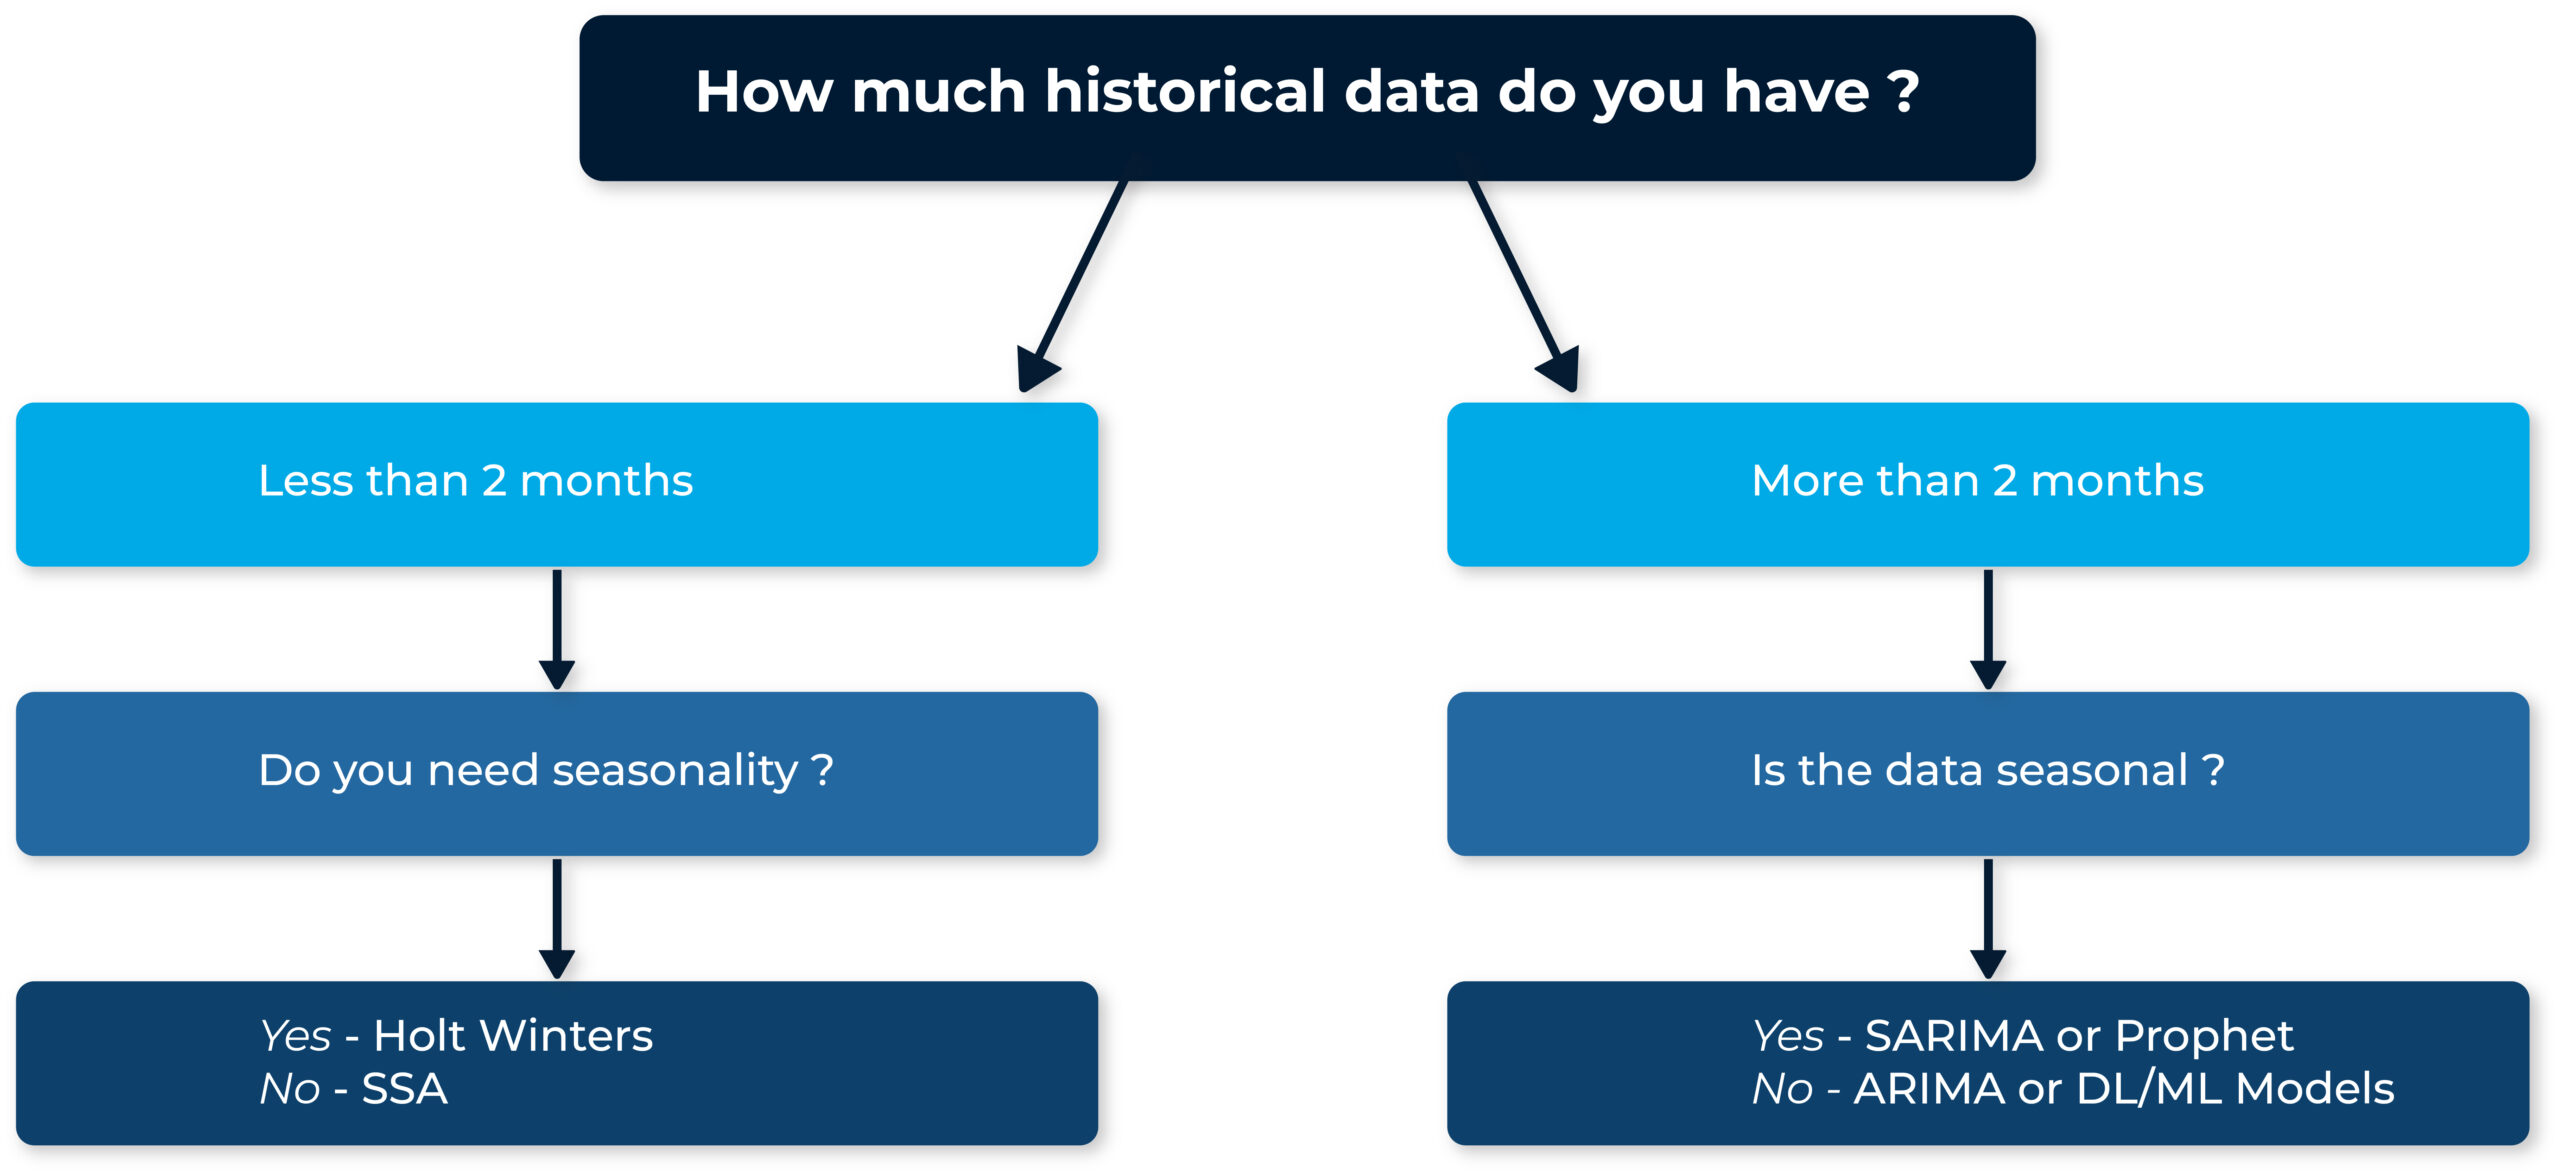
Decision Flowchart
Tech Stack
- Frontend – React with Material UI and Chart.js for interactive charts
- Backend – ASP.NET Core Web API using ML.NET for time series
forecasting - Database – SQL Server with EF Core ORM
- File Upload – Handled via multipart form-data parsing in API Controller
- Authentication – JWT-based secure login
- Forecasting – SSA for Software Product, with scope to integrate other models
Workflow
- User uploads sales data via the UI in Excel format.
- The user selects the start date for forecasting.
- Backend processes the file and applies the chosen forecasting algorithm.
- Forecast results are stored in SQL Server.
- The UI displays results as Line or Bar charts (Pie charts removed for better accuracy in time series visualization).
- Users can download results in Excel and/or as image files.
Note: Forecasting begins from the day after the last date in the uploaded dataset.
User Interface Highlights
The Frontend offers:
- File upload with duplicate-entry prevention
- Date selection for forecast start
- Multiple chart views (Line, Bar, Pie excluded)
- Download options for both Excel and chart images
- Responsive and clean Material UI design
Backend and API Design
The backend handles:
- File parsing and validation
- Duplicate data checks before inserting into SQL Server
- Applying the chosen ML.NET forecasting algorithm
- Returning structured forecast results to the UI
Business Impacts
- Improved forecast accuracy for short-term demand
- Reduced stockouts and overstocking
- Provided flexibility to switch between forecasting algorithms
- Data-driven decision-making enabled with clear visual insights
Next Phase Developments for Better Output
- Add automatic model selection based on historical data analysis
- Extend forecasting horizon using deep learning models
- Integrate real-time dashboards with Power BI
- Incorporate external factors (eg., weather, promotions) to improve accuracy
Conclusion
This software product demonstrates the potential of AI-powered time series forecasting in enabling smarter inventory management and operational planning. While SSA was selected for this Software product due to its ability to produce accurate short-term forecasts with limited data. There is no one-size-fits-all solution for time series forecasting. The best approach depends on the data’s size, seasonality, trend patterns, and the trade-off between interpretability and accuracy. With the right algorithm, time series data can be transformed into accurate, actionable forecasts that drive better business decisions.