What is Grafana?
Grafana is a popular open-source platform for monitoring and observability, widely used for visualizing metrics, logs, and other time-series data. It provides powerful tools for creating interactive and customizable dashboards, enabling users to gain insights from their data in real-time. Grafana supports real-time monitoring through customizable dashboards, providing insights into metrics stored across various sources. With a wide range of visualization options, including graphs and charts, Grafana empowers users to create visually appealing and informative dashboards.

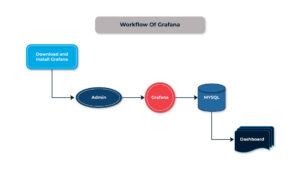
Workflow of Grafana
How to Install Grafana?
Grafana can be installed on various operating systems like Linux, Windows, and macOS.
Following are some of the steps to install Grafana:
Step – 1:
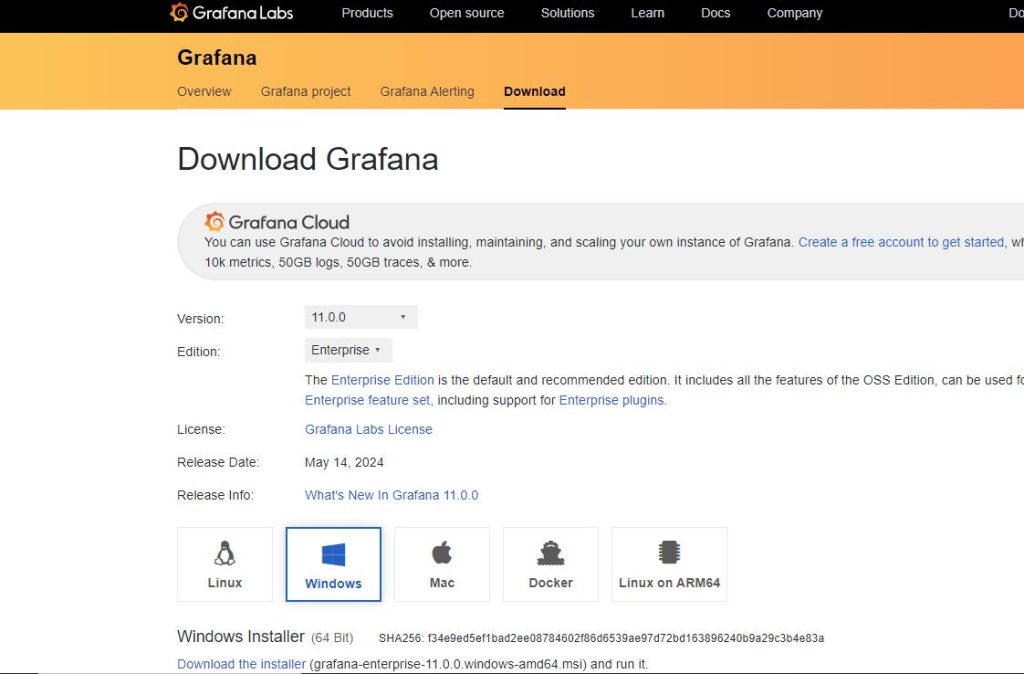
Go to https://grafana.com/grafana/download to download a Windows installer.
Step – 2:
After downloading the installer, a folder named Grafana Labs will be created in C drive – Program Files on our desktop.

Step – 3:
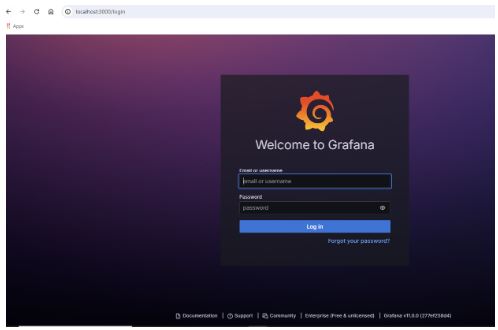
After installation, Grafana is configured through a simple web-based interface. We can log in through http://localhost:3000/login, default username and password were admin & admin. We can change if we want, add data sources, and start creating dashboards.
Adding Datasource In Grafana
In the Grafana interface, navigate to “Connections” in the sidebar menu; click on the “Add new data source” button, and then choose the type of data source you want to add.
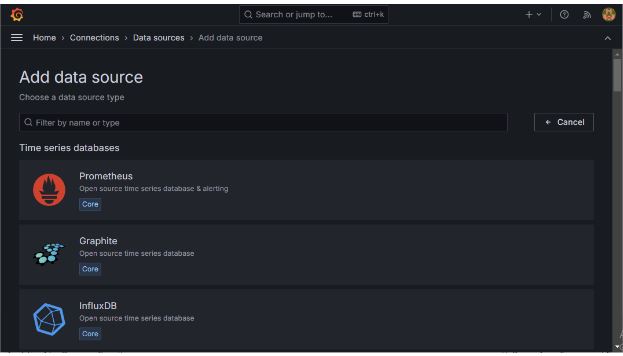
Let’s select the MySQL data source which is shown below,
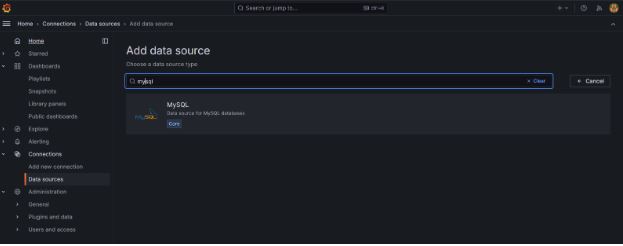
After selecting MySQL, we will be redirected to the MySQL Data Source Configuration screen to set up the required things.
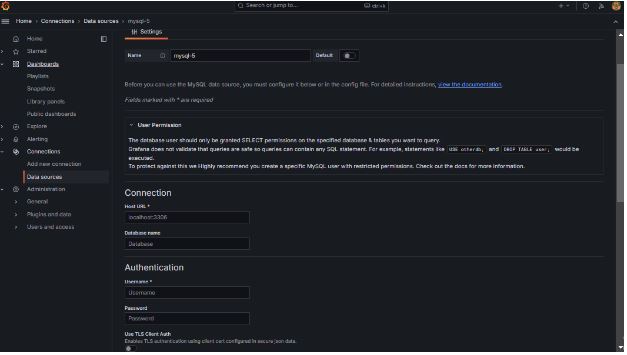
Each type of data source will have specific settings you need to configure.
-
-
-
Name:
A friendly name for the data source.
-
Connection:
Need to provide Host URL and Default Database name
-
Authentication:
If required, provide authentication details (username, password, API key, etc.).
-
Other Settings:
Depending on the data source type, there may be additional settings related to data retention, SSL, etc.
-
Test Connection:
After filling in the required details, it’s a good practice to click on the “Save & Test” button. This checks if Grafana can successfully connect to our data source using the provided settings.
-
Save Data Source:
If the test is successful, click on “Save & Test” again to finalize adding the data source. If there are errors, double-check your settings and credentials.
-
Use the Data Source:
Once added, the data source will appear in your list of configured data sources. we can now use this data source when creating dashboards or panels in Grafana.
-
-
Creating Sample Dashboards
Navigate to the “Dashboards” section in the sidebar menu.

By clicking on New, you can either create a New Dashboard New Folder or Import Dashboard. After clicking on New Dashboard, we will see the below screen which will allow us to Add Visualization or Library Panel or Importing Dashboard.
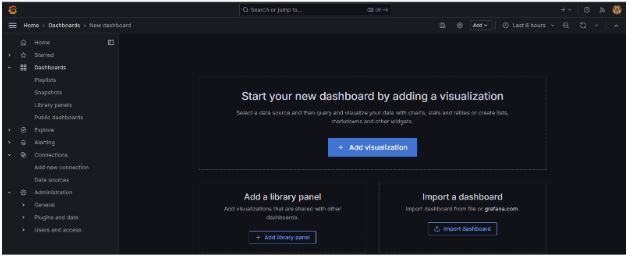
After clicking on Add Visualization, we need to select the required data source that we had created before as shown in the screenshot below –
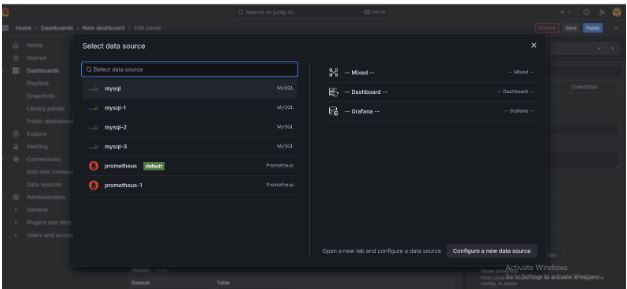
Once we select the data source, we will be redirected to the Grafana Edit Panel where we can create multiple Visualizations like Time Series, Bar Charts, Gauges, Stat etc. We can define proper data sources, data sets, tables, and columns or define our own SQL Query that is required for particular visualization.
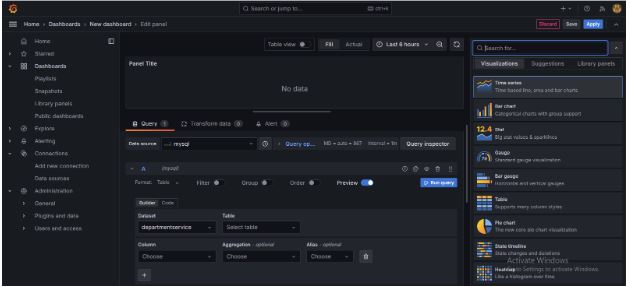
It will also provide a few suggestions for our visualization based on our requirements as below,
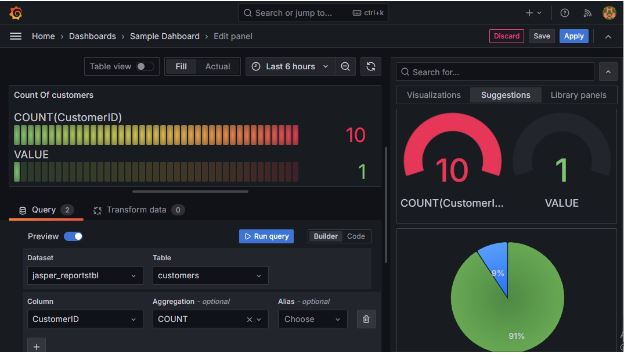
Here, I selected a sample dataset, table, and column and given count as an aggregation to fetch and display customer count. We can also work with other aggregations such as MIN, MAX, SUM, etc.
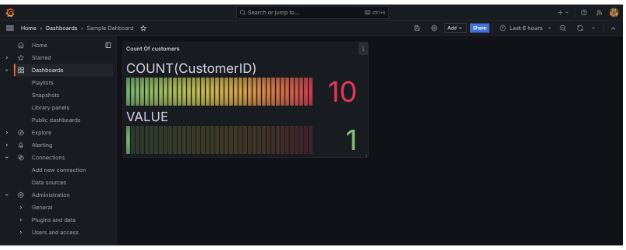
After completion of our design, we simply need to Save and Apply our changes. Once we click on Apply changes, we will be redirected to the output page where we can view our visualization along with that we can edit, share, remove or add visualizations by simply clicking on the three dots in the top right corner.
Conclusion
Grafana simplifies monitoring and visualization, making it a go-to tool for creating interactive dashboards. Its rich visualization options and easy-to-use interface help you transform raw data into actionable insights. Grafana’s flexibility makes it easy to connect with different data sources and customize dashboards to fit your needs. Whether you’re working on a small project or managing large systems, Grafana helps you track and understand your data with ease.


