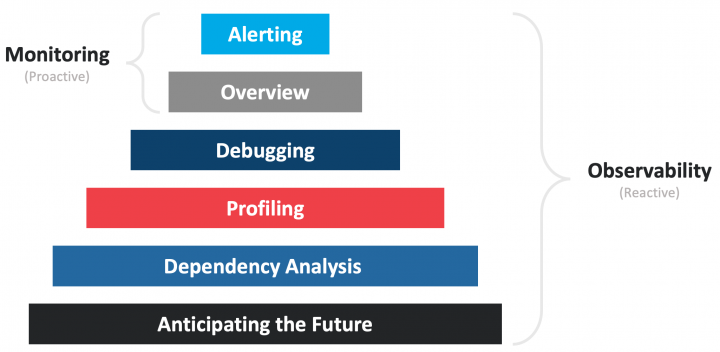
In the ever-changing world of technology, where systems become more complex and dynamic, effective system management and performance optimization are essential. In this scenario, the terms “monitoring” and “observability” are frequently used interchangeably. Although both seem the same, they represent different ideologies, each essential to understanding and improving system behavior. Let’s deep dive into the differences between observability and monitoring, their special qualities, and how they contribute to the robustness of modern systems.
Monitoring
Simply put, it is creating predefined metrics, deploying Collectors/Agents to collect the metrics, and pushing those metrics into the dashboard. Segregated monitoring is based on the platform architecture (On-Prem, Cloud), infrastructure devices (uptime, utilization), applications (URLs, latency), databases (number. of connections), etc. The main purpose of monitoring is to alert for unexpected happenings in pre-defined metrics applied to the targeted resources.
Observability
An advanced monitoring technique that examines the data gathered during monitoring to determine the root cause of the issues. This method analyzes data from dispersed systems using historical data, system interactions, and other sources. It is also useful in debugging problems with interconnected systems and dependencies. Observability heavily relies on metrics, logs, and traces to provide valuable insights.

Differences between Monitoring and Observability
- Data Scope – Monitoring tools typically focus on predefined metrics and KPIs, while observability tools offer broader insights by collecting and analyzing various data types, including logs, traces, and events
- In-depth Analysis – Observability tools provide more advanced analytics and troubleshooting capabilities, allowing DevOps teams to investigate and understand the root causes of issues in complex, distributed systems
- Real-time Monitoring vs. Post-mortem Analysis – Monitoring tools excel in real-time monitoring and alerting, while observability tools are often used for post-mortem analysis and retrospective troubleshooting
Tools Used
Monitoring tools used in DevOps include,
- Prometheus
- Grafana
- Nagios
- Zabbix
- Datadog
Observability tools used in DevOps include,
- ELK Stack (Elasticsearch, Logstash, and Kibana)
- Jaeger
- Zipkin
- Fluentd
- Splunk

When to Use Monitoring?
- When you have predefined metrics or key performance indicators (KPIs) that you need to track
- To identify deviations from expected behavior and receive alerts for immediate action
When to Use Observability?
- When you need to understand the root cause of complex issues or unexpected behaviors
- For diagnosing unknown or urgent issues, understanding system interactions, and gaining insights into system behavior over time
Conclusion
Monitoring is focused on collecting and alerting predefined metrics. Observability is a broader concept that encompasses the ability to explore, understand, and troubleshoot a system based on a wide range of data sources. Observability is often considered critical in modern, complex, and dynamic systems, like those built on microservices and containers, where traditional monitoring may fall short of providing a complete understanding of system behavior. Organizations often combine monitoring and observability approaches in real time to gain comprehensive insights into their systems.


