
Why Monitoring Modern Applications Is Challenging
Modern applications are built on cloud-native architectures, microservices, containers, and distributed systems, making them increasingly difficult to monitor using traditional tools. As environments become more dynamic, organizations require deeper visibility into application performance, infrastructure, and digital user experience. AI-powered observability platforms, such as Dynatrace, help address this complexity by providing real-time insights, automated issue detection, and intelligent root cause analysis.
Dynatrace AI Observability: A Smarter Way to Monitor Modern Systems
Dynatrace AI Observability is an AI-powered monitoring and observability platform that provides real-time visibility into applications, infrastructure, and digital user experiences. As cloud-native environments consist of interconnected microservices, containers, APIs, and databases, identifying performance issues becomes increasingly complex. Dynatrace simplifies monitoring by automatically collecting, analyzing, and correlating telemetry data from across the environment.
Organizations use Dynatrace to gain end-to-end visibility into complex IT environments and accelerate issue resolution. Features such as automatic service discovery, distributed tracing, real-time performance monitoring, dependency mapping, and Davis AI help teams detect anomalies, identify root causes, and understand service relationships. This enables faster troubleshooting, improved application reliability, and better digital experiences.
Dynatrace AI Observability Architecture Overview
The following architecture illustrates how Dynatrace collects telemetry data, analyzes system behavior, and provides end-to-end observability across applications, infrastructure, and digital user experiences.
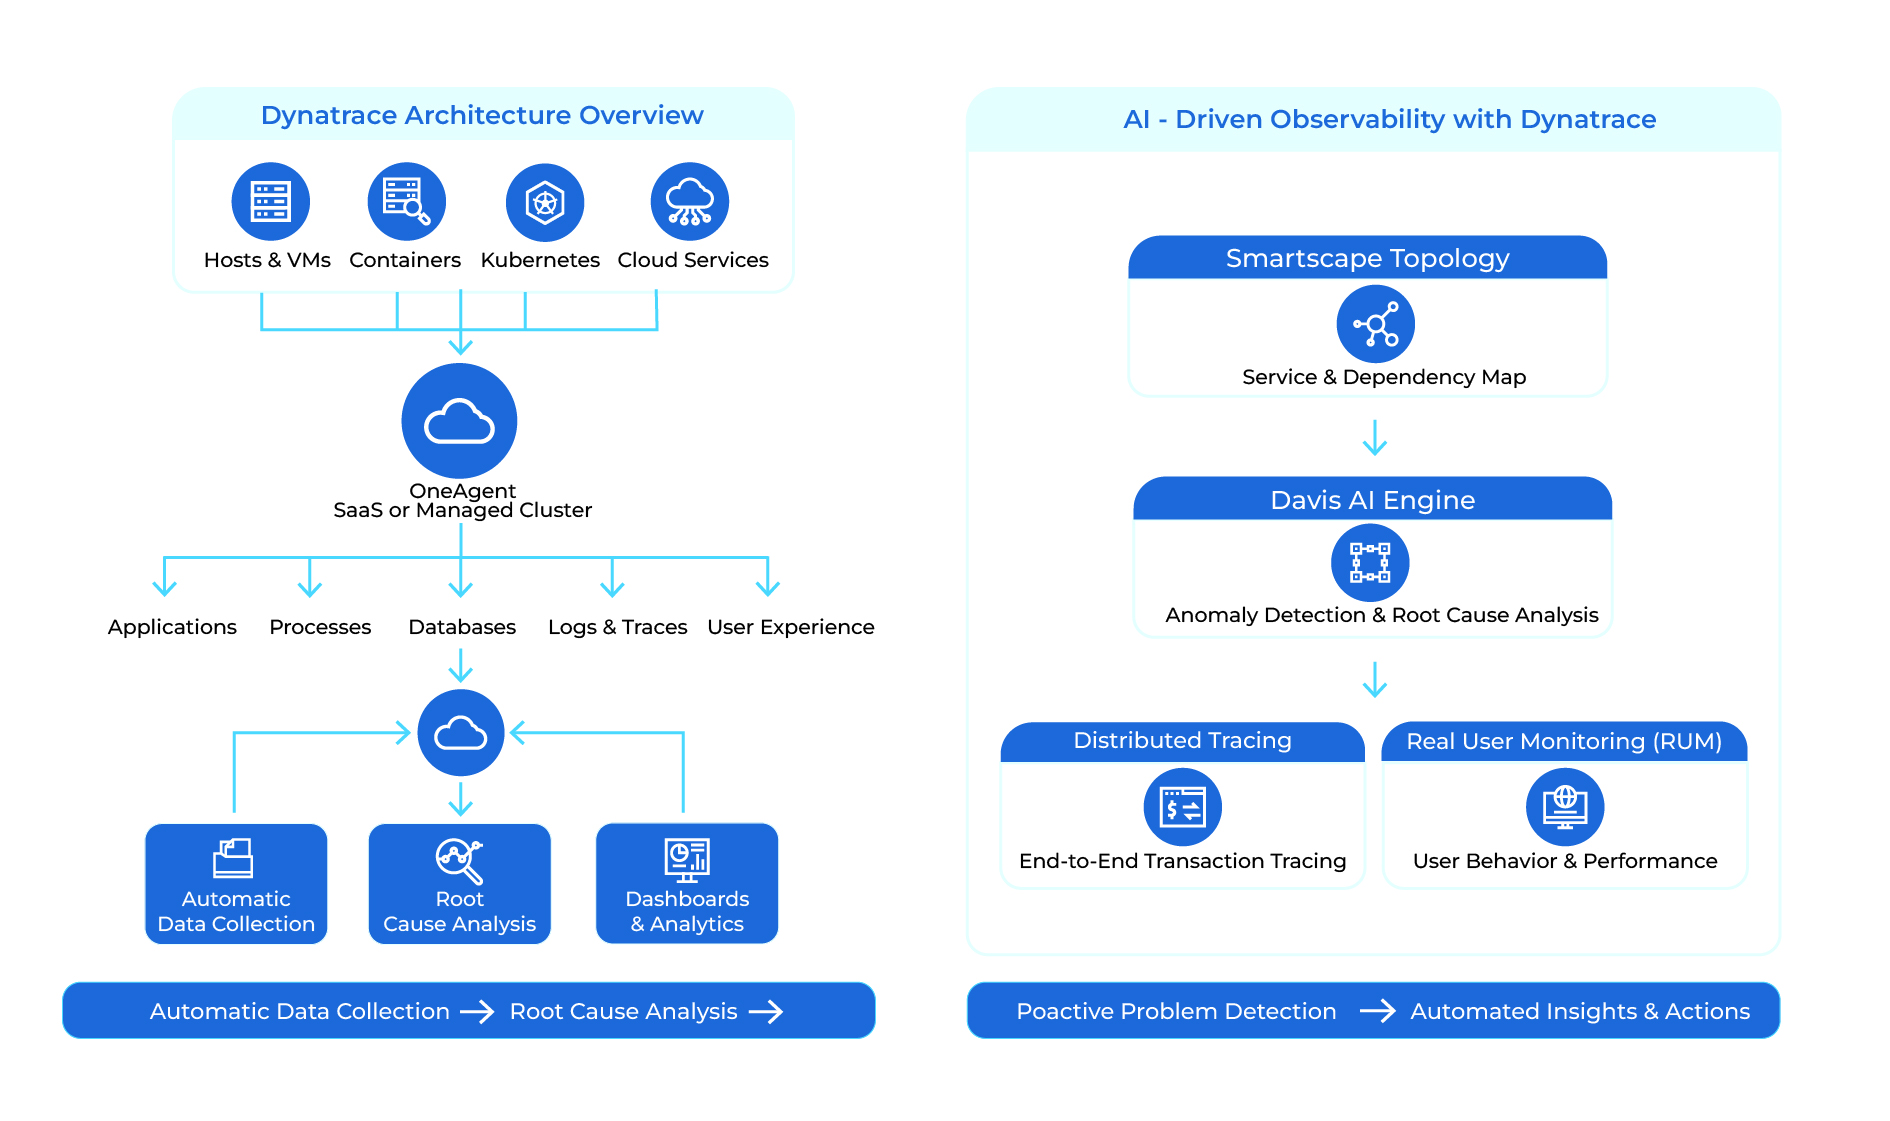
- Installing Dynatrace OneAgent on hosts, virtual machines, containers, or Kubernetes nodes is the first step in the deployment process.
- After installation, OneAgent automatically discovers applications, services, processes, databases, and their dependencies across the monitored environment.
- It continuously collects metrics, logs, distributed traces, and user experience data from every connected system component.
- OneAgent monitors infrastructure, applications, networks, and digital user experiences to provide complete observability across the environment.
- The collected data is securely transmitted to the Dynatrace platform, either SaaS or Managed, for centralized processing.
- Dynatrace AI analyzes incoming data to detect performance issues, anomalies, and unusual behavior across interconnected applications and infrastructure.
- The platform automatically builds a real-time topology and dependency map showing relationships between services, hosts, applications, and supporting resources.
- Dashboards and service flow views provide clear visibility into system health, performance trends, and application dependencies.
- Dynatrace simplifies troubleshooting by correlating events, identifying root causes, and reducing the time required to resolve issues.
- The architecture supports cloud-native architectures, microservices, Kubernetes, and multi-cloud environments, delivering consistent observability across distributed application ecosystems.
Making Monitoring Intelligent with AIOps
In Dynatrace, AIOps helps make monitoring easier and more intelligent. Instead of only showing many alerts or raw performance data, Dynatrace uses artificial intelligence to automatically study the data collected from applications and infrastructure. This supports teams in understanding system issues without spending significant time checking different tools or dashboards.
Dynatrace AIOps learns normal system behavior and automatically detects anomalies such as slow responses, increased errors, or high resource usage. It identifies the root cause, shows the impact across connected services, and reduces unnecessary alerts. This enables faster troubleshooting, minimizes downtime, and keeps applications running reliably in complex cloud environments.
OneAgent: The Foundation of Dynatrace Monitoring
OneAgent is the main component in Dynatrace that helps collect monitoring data from the environment. Engineers install OneAgent on servers, virtual machines, or Kubernetes nodes running applications. OneAgent automatically discovers services, processes, containers, and dependencies without manual setup. It starts monitoring system performance by collecting CPU usage, memory utilization, response time, error, and log data.
Engineers use OneAgent to stay up to date on new applications, infrastructure, or cloud environments. It helps them see how all the parts of the system work together. OneAgent continuously sends performance data to the Dynatrace platform. This helps find problems faster and better understand how the system works. It also makes it easier to keep an eye on the environment, reduces the amount of manual work, and allows engineers to keep applications stable and reliable.
Smartscape: Visualizing Service Dependencies
Dynatrace Smartscape illustrates the connections between various services and application components. It automatically generates a visual map of service-to-service communication and request flow in real time. This visualization helps teams understand the system topology and dependencies more clearly. When a problem arises, engineers can rapidly identify which service is impacted and how it affects other components. This increases overall system visibility and speeds up troubleshooting.
Davis AI: Faster Root Cause Detection
Dynatrace’s intelligence engine, Davis AI, helps teams identify and understand performance issues more quickly by automatically analyzing data from applications, infrastructure, and digital user experience to learn normal system behavior. When it detects unusual changes, such as slow response times, increased errors, or high resource usage, it identifies the problem, highlights the potential root cause, links related events, and shows affected services, enabling faster troubleshooting while reducing alert noise.
Conclusion
Monitoring applications has become more challenging as cloud and microservices environments continue to grow in complexity. Dynatrace addresses these challenges by providing intelligent, end-to-end observability through a single platform. With capabilities such as OneAgent, Smartscape topology, AIOps, and Davis AI, teams gain clear visibility into system behavior, quickly identify the root causes of performance issues, reduce manual effort, and accelerate troubleshooting, helping organizations maintain stable, reliable, and high-performing applications while improving digital user experiences.